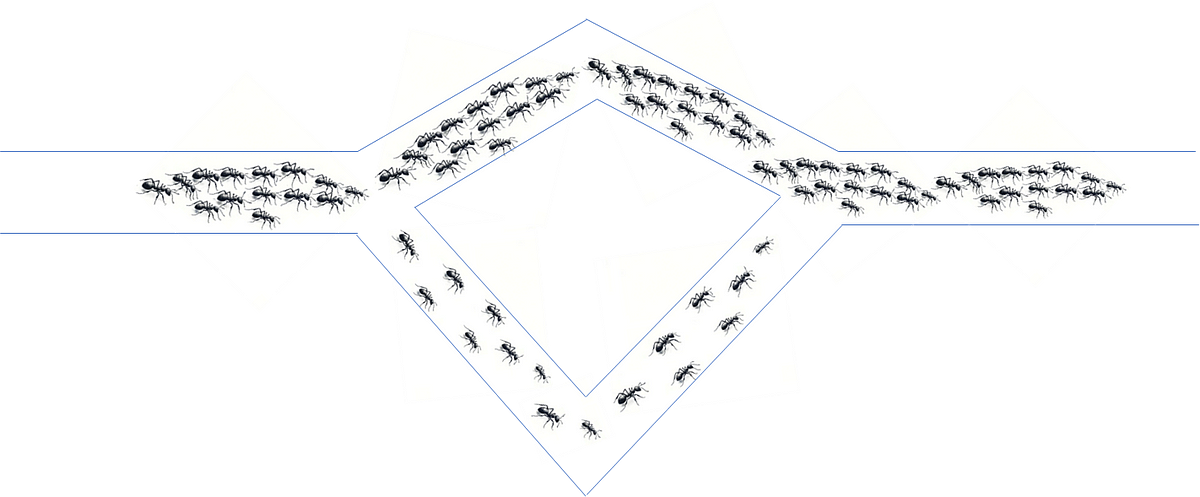
Discover the concepts and basic methods of causal machine learning applied in Python Photo by David Clode on UnsplashCausal inference has many tangible applications in a wide variety of scenarios, but in my experience, it is a subject that is rarely talked about among data scientists. In this article, we define causal inference and motivate…


